Live-cell imaging reveals the spatiotemporal organization of endogenous RNA polymerase II phosphorylation at a single gene
Linda S. Forero-Quintero, William Raymond, Tetsuya Handa, Matthew N. Saxton, Tatsuya Morisaki, Tatsuya Morisaki, Hiroshi Kimura, Edouard Bertrand, Brian Munsky, and Timothy J. Stasevich
Link to the paper: 
Key Takeaway:
The entirety of DNA transcription can be interrogated at a single transcription site with careful fluosecence microscopy experimental design. For the first time, recruitment, initiation, and elongation can be watched in a live cell simultaneously. Computational models determine that 5 to 40 RNAP2 cluster around an HIV promotor of a single copy gene during a typical transcriptional burst, with most phosphorylated at Serine 5 within 6 seconds of arrival and roughly half escaping the promoter in ~1.5 minutes.
I contributed significantly to the computational modeling portion of the paper, performing model selection of several different models (supplemental information) with the help of my PI, Dr. Brian Munsky.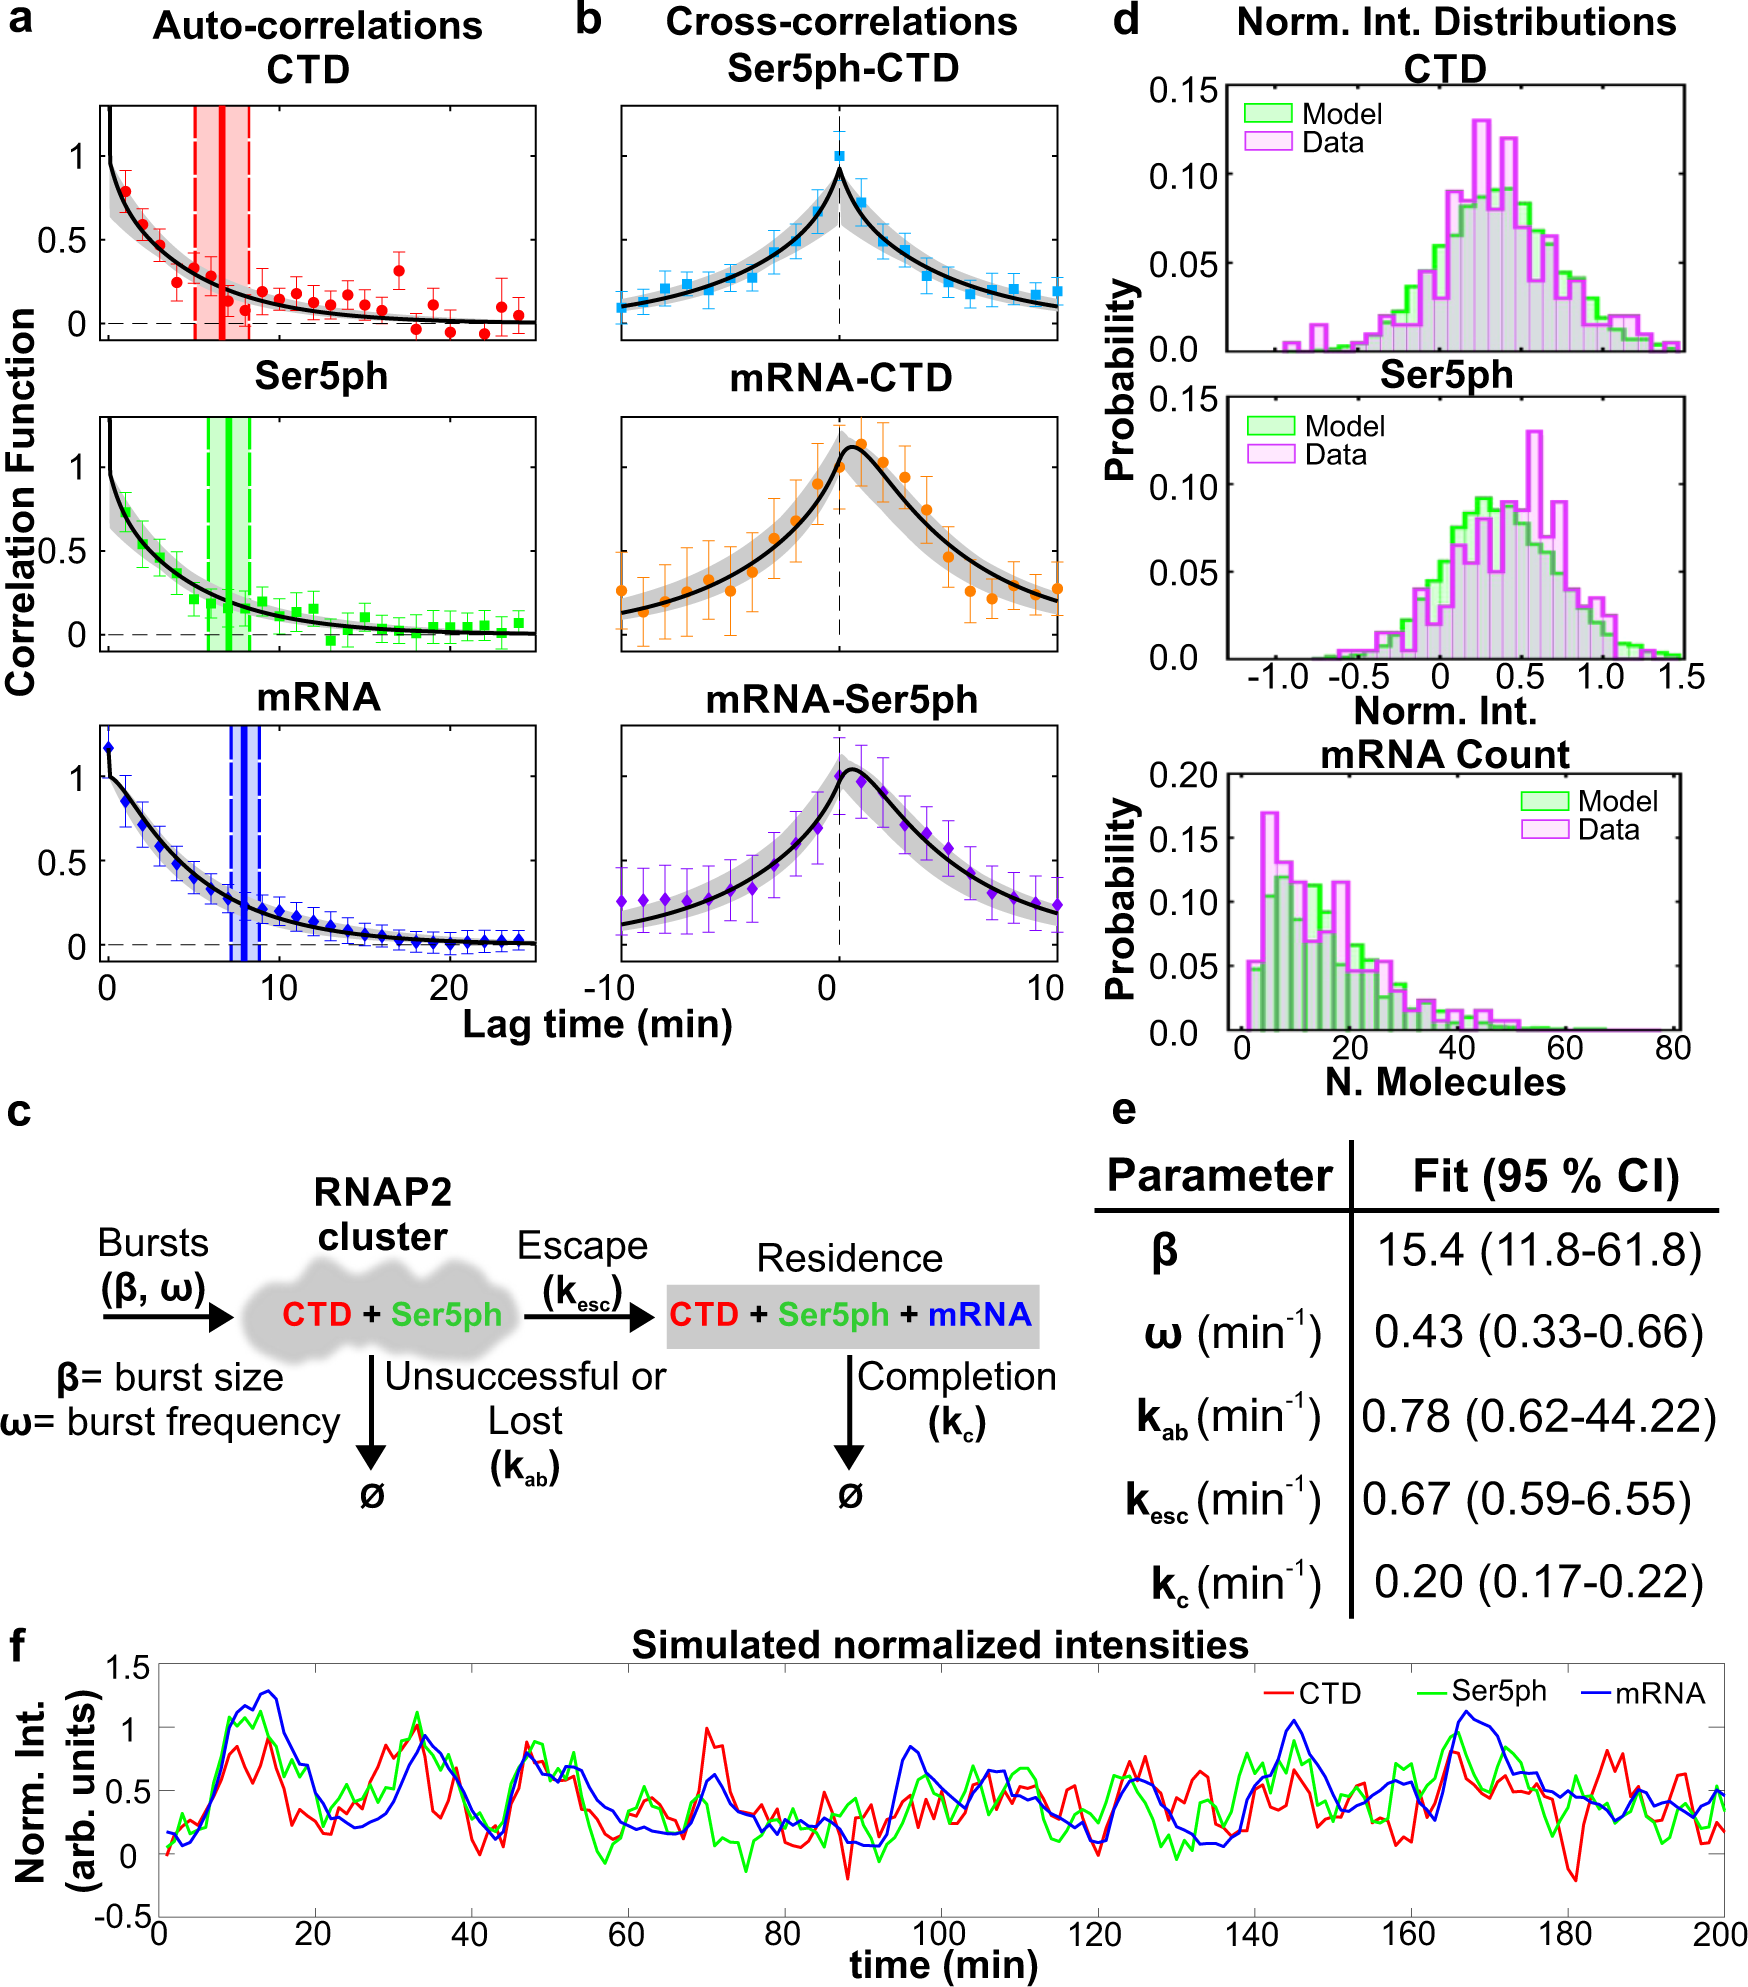 a), b) Measured and modeled (a) auto-correlation functions AC(τ)/G(0) for each signal: CTD-RNAP2 (red circles), Ser5ph-RNAP2 (green squares), and mRNA (blue diamonds). Dwell time is defined as the time at which the autocovariance dropped below 20% of its zero-lag value (vertical full lines). Dwell time uncertainty is estimated from the model using the standard deviation from 400 simulated data sets, each with 20 cells over 200 min with 1 min simulation resolution (vertical dashed lines). b Cross-correlation function CC(τ)/G(0) between signal pairs: Ser5ph-RNAP2 and CTD-RNAP2 (cyan squares), mRNA and CTD-RNAP2 (orange circles), and mRNA and Ser5ph-RNAP2 (purple diamonds) at the transcription site. Model Maximum Likelihood Estimate (MLE) fit in black and sampled uncertainty in gray. c) A simple model to capture RNAP2 fluctuation dynamics at the HIV-1 reporter gene. RNAP2 enters the transcription cluster with an average geometric burst with average burst size, β, and burst frequency, ω. Phosphorylation of Serine 5 is assumed to be fast (<<1 min) and/or the RNAP2 enters in a pre-phosphorylated form. RNAP2 can be lost from the cluster with rate kab or escape with rate kesc. RNAP2 completes transcription with rate kc. d Probability distributions for CTD-RNAP2 and Ser5ph-RNAP2 (arbitrary units of fluorescence), and mRNA (units of mature mRNA) for experimental data (purple) and model MLE predictions (green). e) MLE parameters and 95% confidence interval (CI) range. Statistics presented for the data are the sample means ± S.E.M. n=number of cells/number of independent experiments (20/8). f) Simulated trajectory (with shot noise equal to that of experiments) of CTD-RNAP2 (red), Ser5ph-RNAP2 (green), and mRNA (blue) intensities normalized to have a 95 percentile of unity.
Key Figure:
a), b) Measured and modeled (a) auto-correlation functions AC(τ)/G(0) for each signal: CTD-RNAP2 (red circles), Ser5ph-RNAP2 (green squares), and mRNA (blue diamonds). Dwell time is defined as the time at which the autocovariance dropped below 20% of its zero-lag value (vertical full lines). Dwell time uncertainty is estimated from the model using the standard deviation from 400 simulated data sets, each with 20 cells over 200 min with 1 min simulation resolution (vertical dashed lines). b Cross-correlation function CC(τ)/G(0) between signal pairs: Ser5ph-RNAP2 and CTD-RNAP2 (cyan squares), mRNA and CTD-RNAP2 (orange circles), and mRNA and Ser5ph-RNAP2 (purple diamonds) at the transcription site. Model Maximum Likelihood Estimate (MLE) fit in black and sampled uncertainty in gray. c) A simple model to capture RNAP2 fluctuation dynamics at the HIV-1 reporter gene. RNAP2 enters the transcription cluster with an average geometric burst with average burst size, β, and burst frequency, ω. Phosphorylation of Serine 5 is assumed to be fast (<<1 min) and/or the RNAP2 enters in a pre-phosphorylated form. RNAP2 can be lost from the cluster with rate kab or escape with rate kesc. RNAP2 completes transcription with rate kc. d Probability distributions for CTD-RNAP2 and Ser5ph-RNAP2 (arbitrary units of fluorescence), and mRNA (units of mature mRNA) for experimental data (purple) and model MLE predictions (green). e) MLE parameters and 95% confidence interval (CI) range. Statistics presented for the data are the sample means ± S.E.M. n=number of cells/number of independent experiments (20/8). f) Simulated trajectory (with shot noise equal to that of experiments) of CTD-RNAP2 (red), Ser5ph-RNAP2 (green), and mRNA (blue) intensities normalized to have a 95 percentile of unity. Abstract:
The carboxyl-terminal domain of RNA polymerase II (RNAP2) is phosphorylated during transcription in eukaryotic cells. While residue-specific phosphorylation has been mapped with exquisite spatial resolution along the 1D genome in a population of fixed cells using immunoprecipitation-based assays, the timing, kinetics, and spatial organization of phosphorylation along a single-copy gene have not yet been measured in living cells. Here, we achieve this by combining multi-color, single-molecule microscopy with fluorescent antibody-based probes that specifically bind to different phosphorylated forms of endogenous RNAP2 in living cells. Applying this methodology to a single-copy HIV-1 reporter gene provides live-cell evidence for heterogeneity in the distribution of RNAP2 along the length of the gene as well as Serine 5 phosphorylated RNAP2 clusters that remain separated in both space and time from nascent mRNA synthesis. Computational models determine that 5 to 40 RNAP2 cluster around the promoter during a typical transcriptional burst, with most phosphorylated at Serine 5 within 6 seconds of arrival and roughly half escaping the promoter in ~1.5 minutes. Taken together, our data provide live-cell support for the notion of efficient transcription clusters that transiently form around promoters and contain high concentrations of RNAP2 phosphorylated at Serine 5. Back to publications 